The software as a Service (SaaS) industry is rapidly growing due to its adoption in the majority of the sectors worldwide.
Currently, the global SaaS market is valued at approximately $247.2 billion and is projected to grow to $295.08 billion by the end of 2025.
An average organization has over 130 SaaS applications, reflecting a significant increase in the adoption of SaaS software worldwide. Further, 92% of the business leaders are looking forward to investing in AI-powered SaaS software in the year 2024.
Let’s take a closer look at the current state of the SaaS industry, its market, its adoption, and more in this article.
SaaS Statistics: At A Glance
- There are over 30,800 SaaS companies worldwide.
- There are 17,000 SaaS companies in the United States.
- The SaaS industry grew by 500% in just 7 years between 2015 and 2022.
- The SaaS market is projected to reach a valuation of $295.08 billion by 2025.
- By 2025, it is anticipated that 85% of the software utilized by companies will be SaaS-based.
- On average, end-users allocate 35% of their public cloud expenditure to SaaS services.
- According to 43% of companies, the primary obstacles in adopting SaaS are identity and access governance.
SaaS Industry Statistics
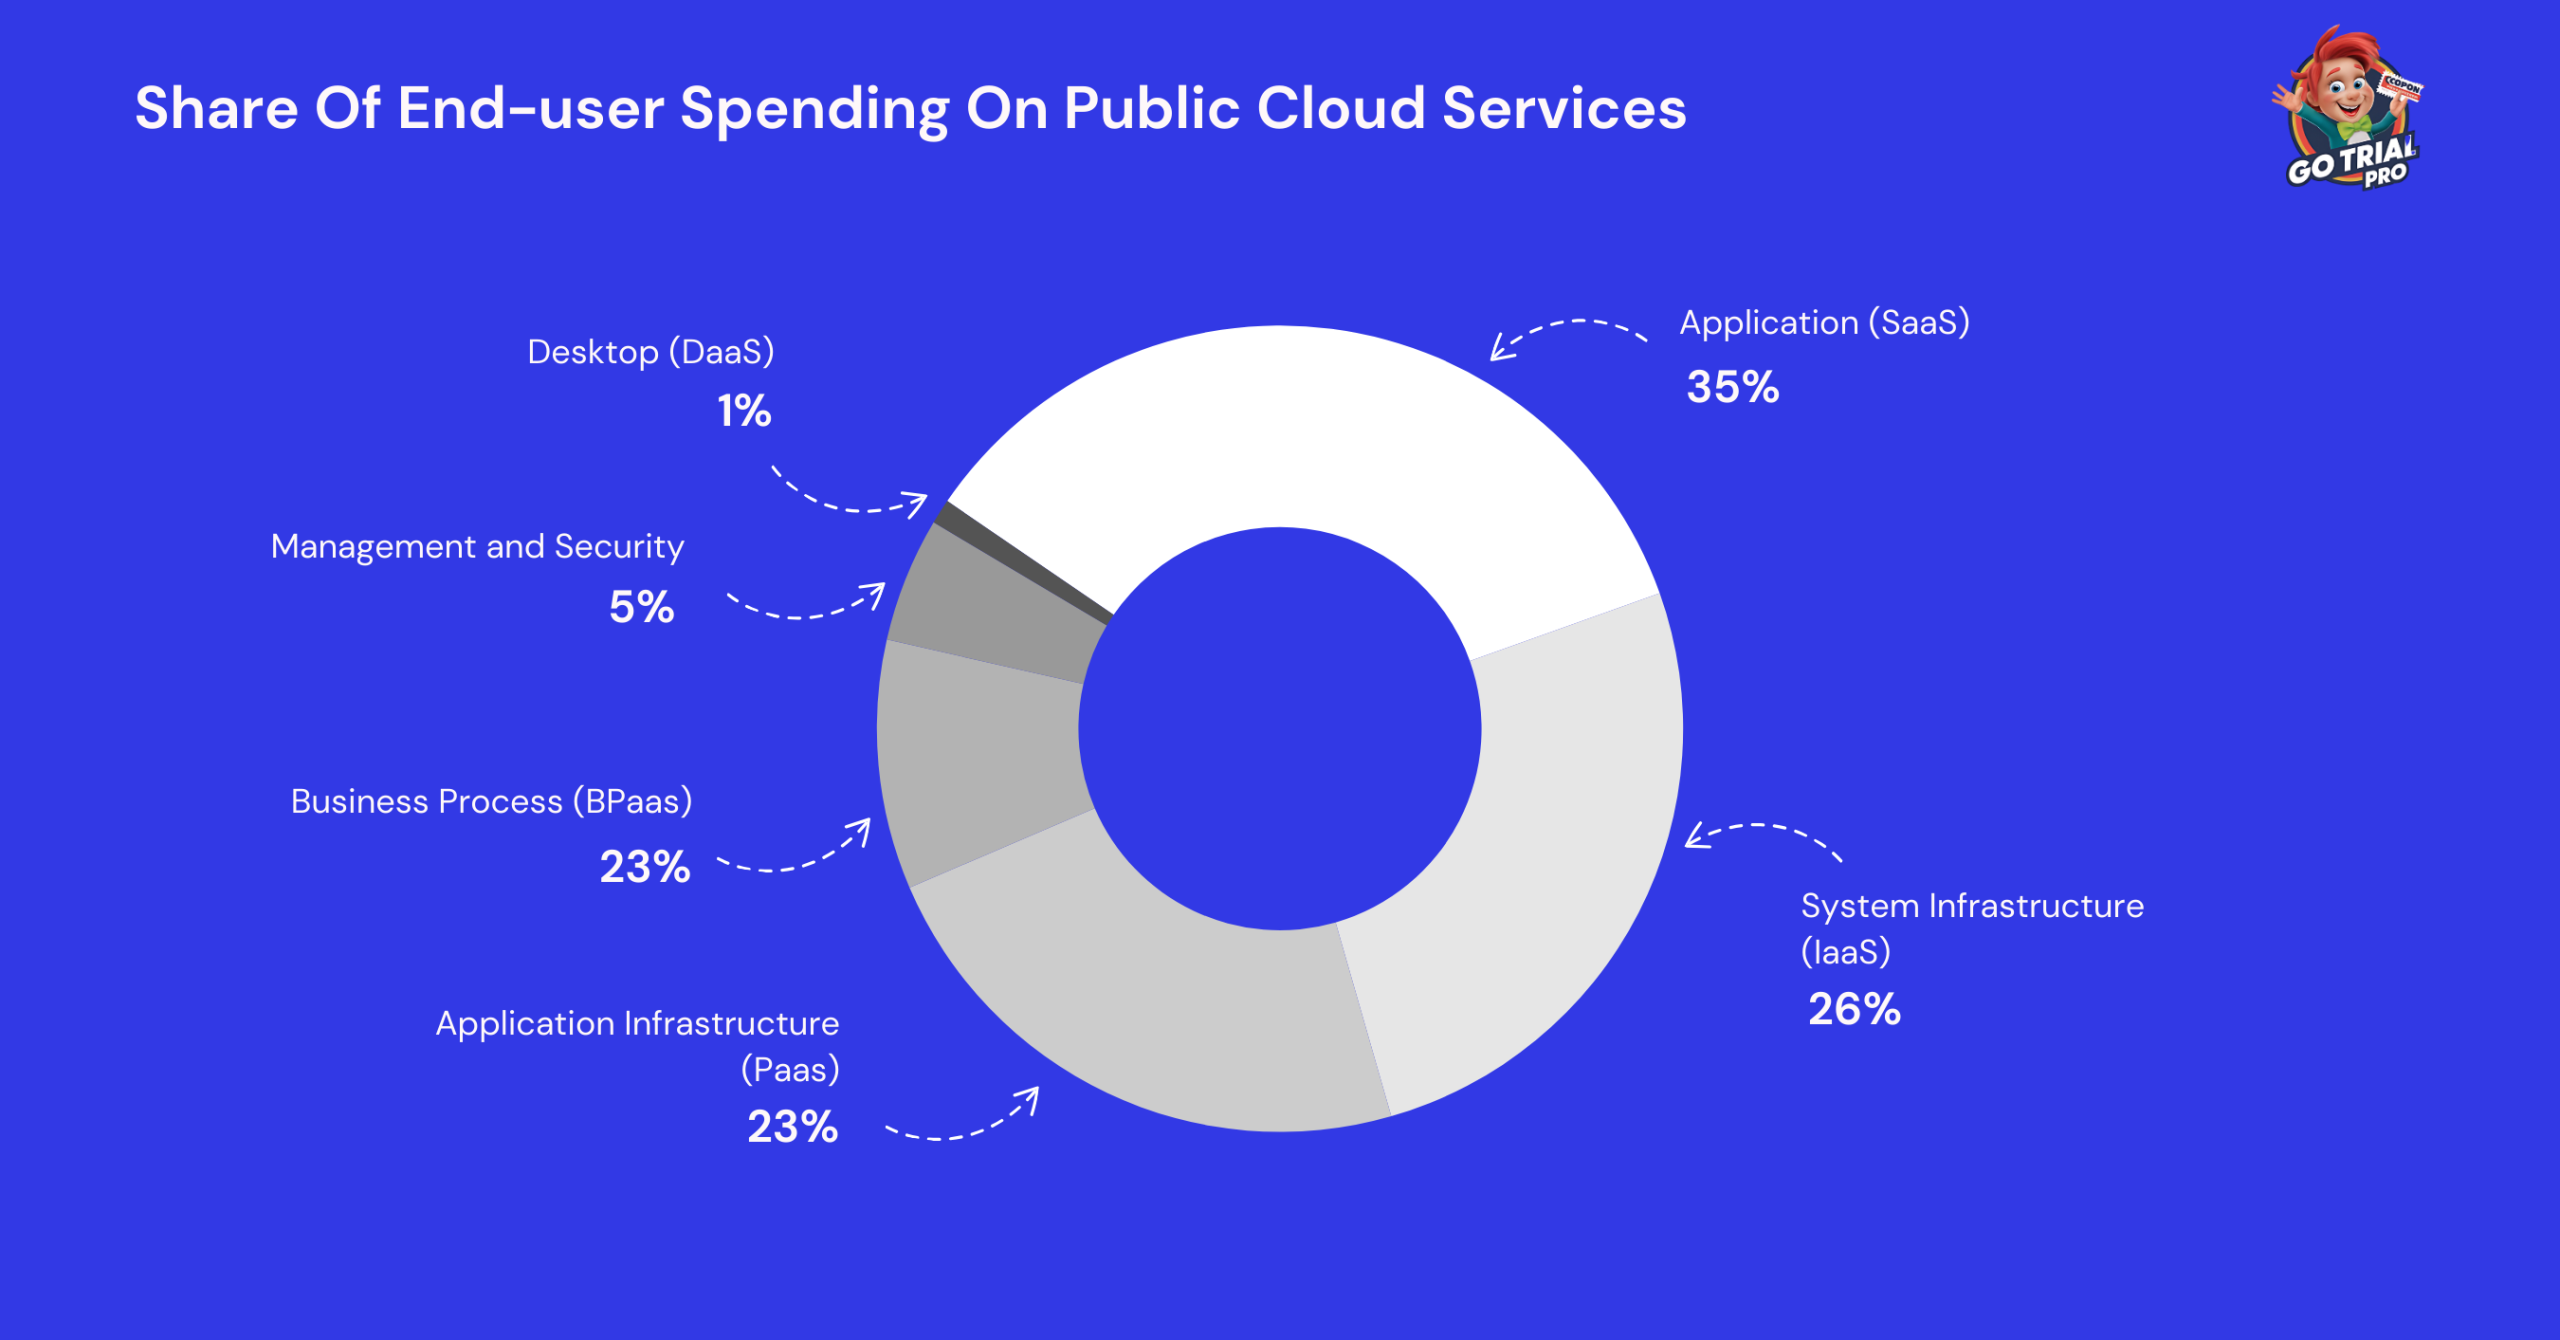
- On average, end-users spend 35% of their public cloud spending on SaaS services.
End-users prefer to spend more on SaaS than on other service types.
On the other hand, just 1% of their spending goes to DaaS.
IaaS and PaaS have also managed to grab a significant share of user spending.

Here is a table displaying the share of end-user spending on public cloud services.
| Public Cloud Service | Share Of User Expenditure |
|---|---|
| Application (SaaS) | 35% |
| System Infrastructure (IaaS) | 26% |
| Application Infrastructure (Paas) | 23% |
| Business Process (BPaas) | 10% |
| Management and Security | 5% |
| Desktop (DaaS) | 1% |
Source: Gartner.
- 22.5% of the companies witnessed no impact of the pandemic on their spending on SaaS software.
However, 23.5% of the companies stated that their spending on SaaS companies decreased after the pandemic.
11.9% of the companies stated that their spending declined by just 10% to 20%, while 11.6% of the companies reported that their spending decreased by more than 20% due to the effect of the pandemic.
Conversely. 30.4% of the companies stated that they spent more on SaaS software after the pandemic due to the increase in remote work.
Source: IDC
SaaS Market Size Statistics
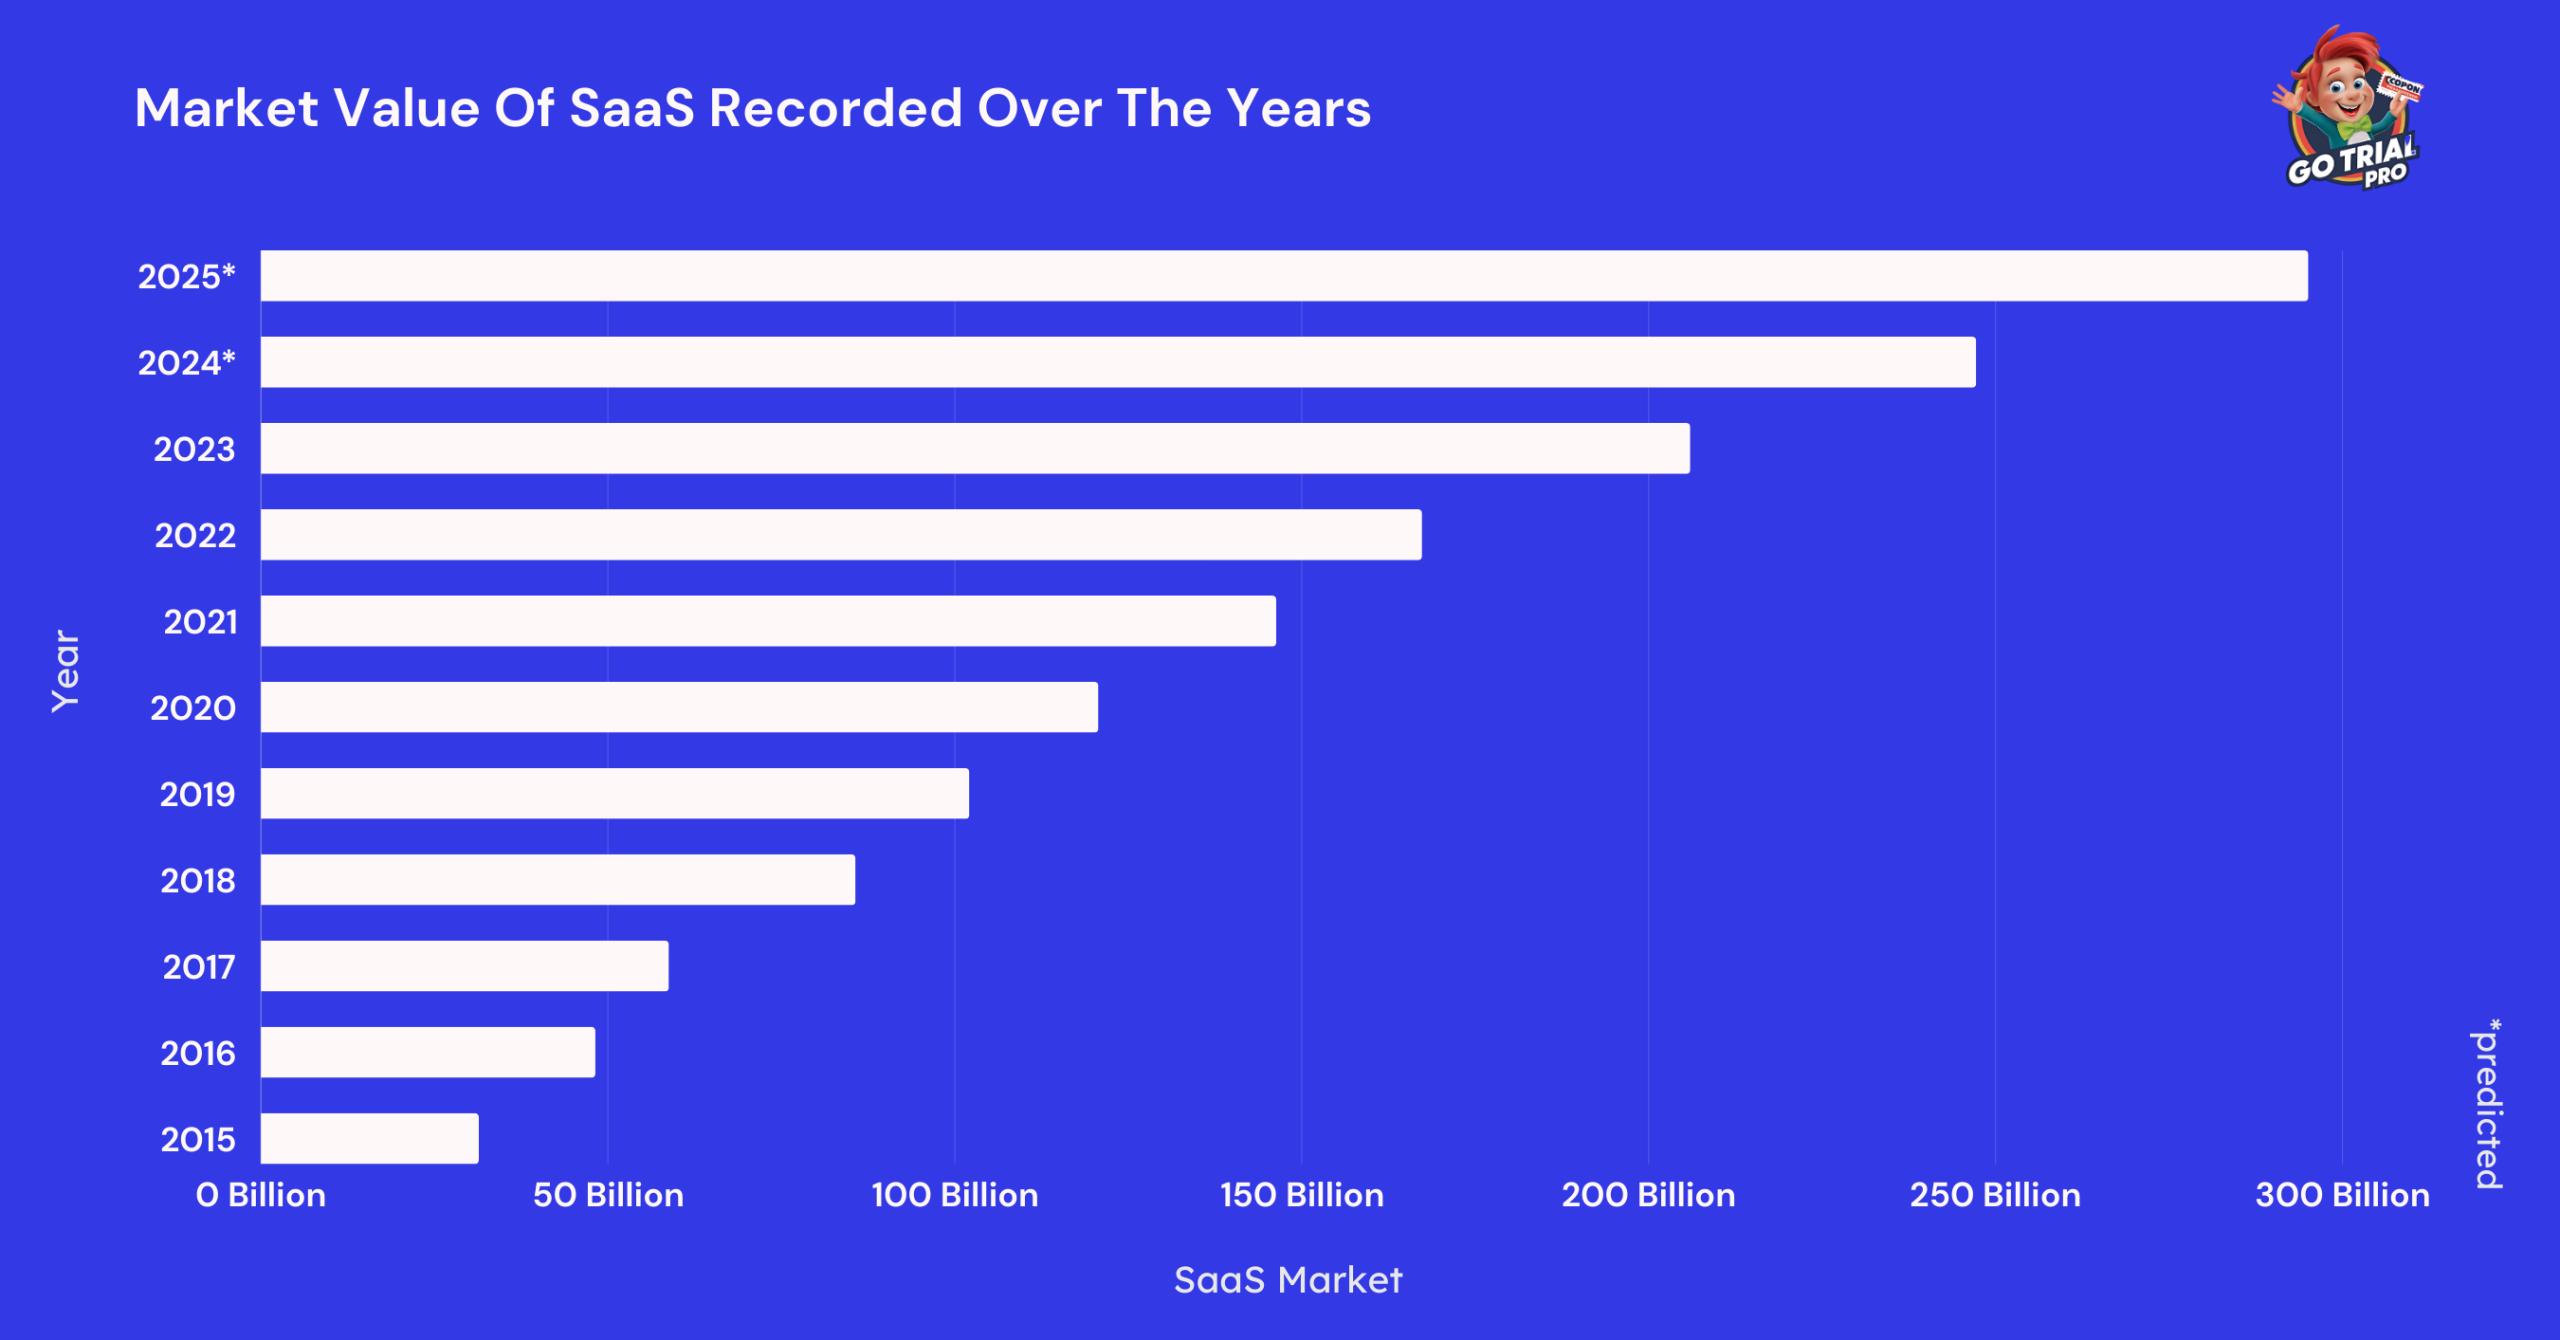
- The SaaS market is estimated to be valued at $247.2 billion.
Meanwhile, in 2023, the SaaS market was recorded to be valued at $206 billion in 2023 and is expected to reach a market value of $295.08 billion.
Comparatively, the SaaS market was valued at just $102.1 billion in 2019 and grew by approximately $104 billion between 2019 and 2023.

The following table displays the market value of SaaS recorded over the years.
| Year | SaaS Market |
|---|---|
| 2025* | 295.08 billion |
| 2024 | 247.2 billion |
| 2023 | 206 billion |
| 2022 | 167.34 billion |
| 2021 | 146.33 billion |
| 2020 | 120.7 billion |
| 2019 | 102.1 billion |
| 2018 | 85.7 billion |
| 2017 | 58.8 billion |
| 2016 | 48.2 billion |
| 2015 | 31.4 billion |
Source: Statista
SaaS Growth Statistics
- Over the past 7 years, the SaaS industry has grown by approximately 500%.
The SaaS industry is approximately worth $195 billion.
Between 2015 and 2022, the SaaS industry grew from $31.4 billion to approximately $167.11 billion in 2022. That displays the industry grew by 5 times between 2015 and 2022.
Further, by the end of 2023, the SaaS industry was estimated to have reached $195.21 billion.
Source: Gartner
How Many SaaS Companies Are There?
- There are over 30,800 SaaS companies worldwide.
Comparatively, the number of SaaS companies worldwide was 30,000 in 2023 and 25,000 in 2021.
Further, by the end of 2024, the SaaS market is estimated to have 72,000 companies in operation.
The majority of SaaS companies are in the United States as of 2024.
Meanwhile, Salesforce is the largest SaaS company in the world, and it contributed $34.86 billion in SaaS revenue in the fiscal year 2024.
Source: Ascendix
How Many SaaS Companies Are There In the US?
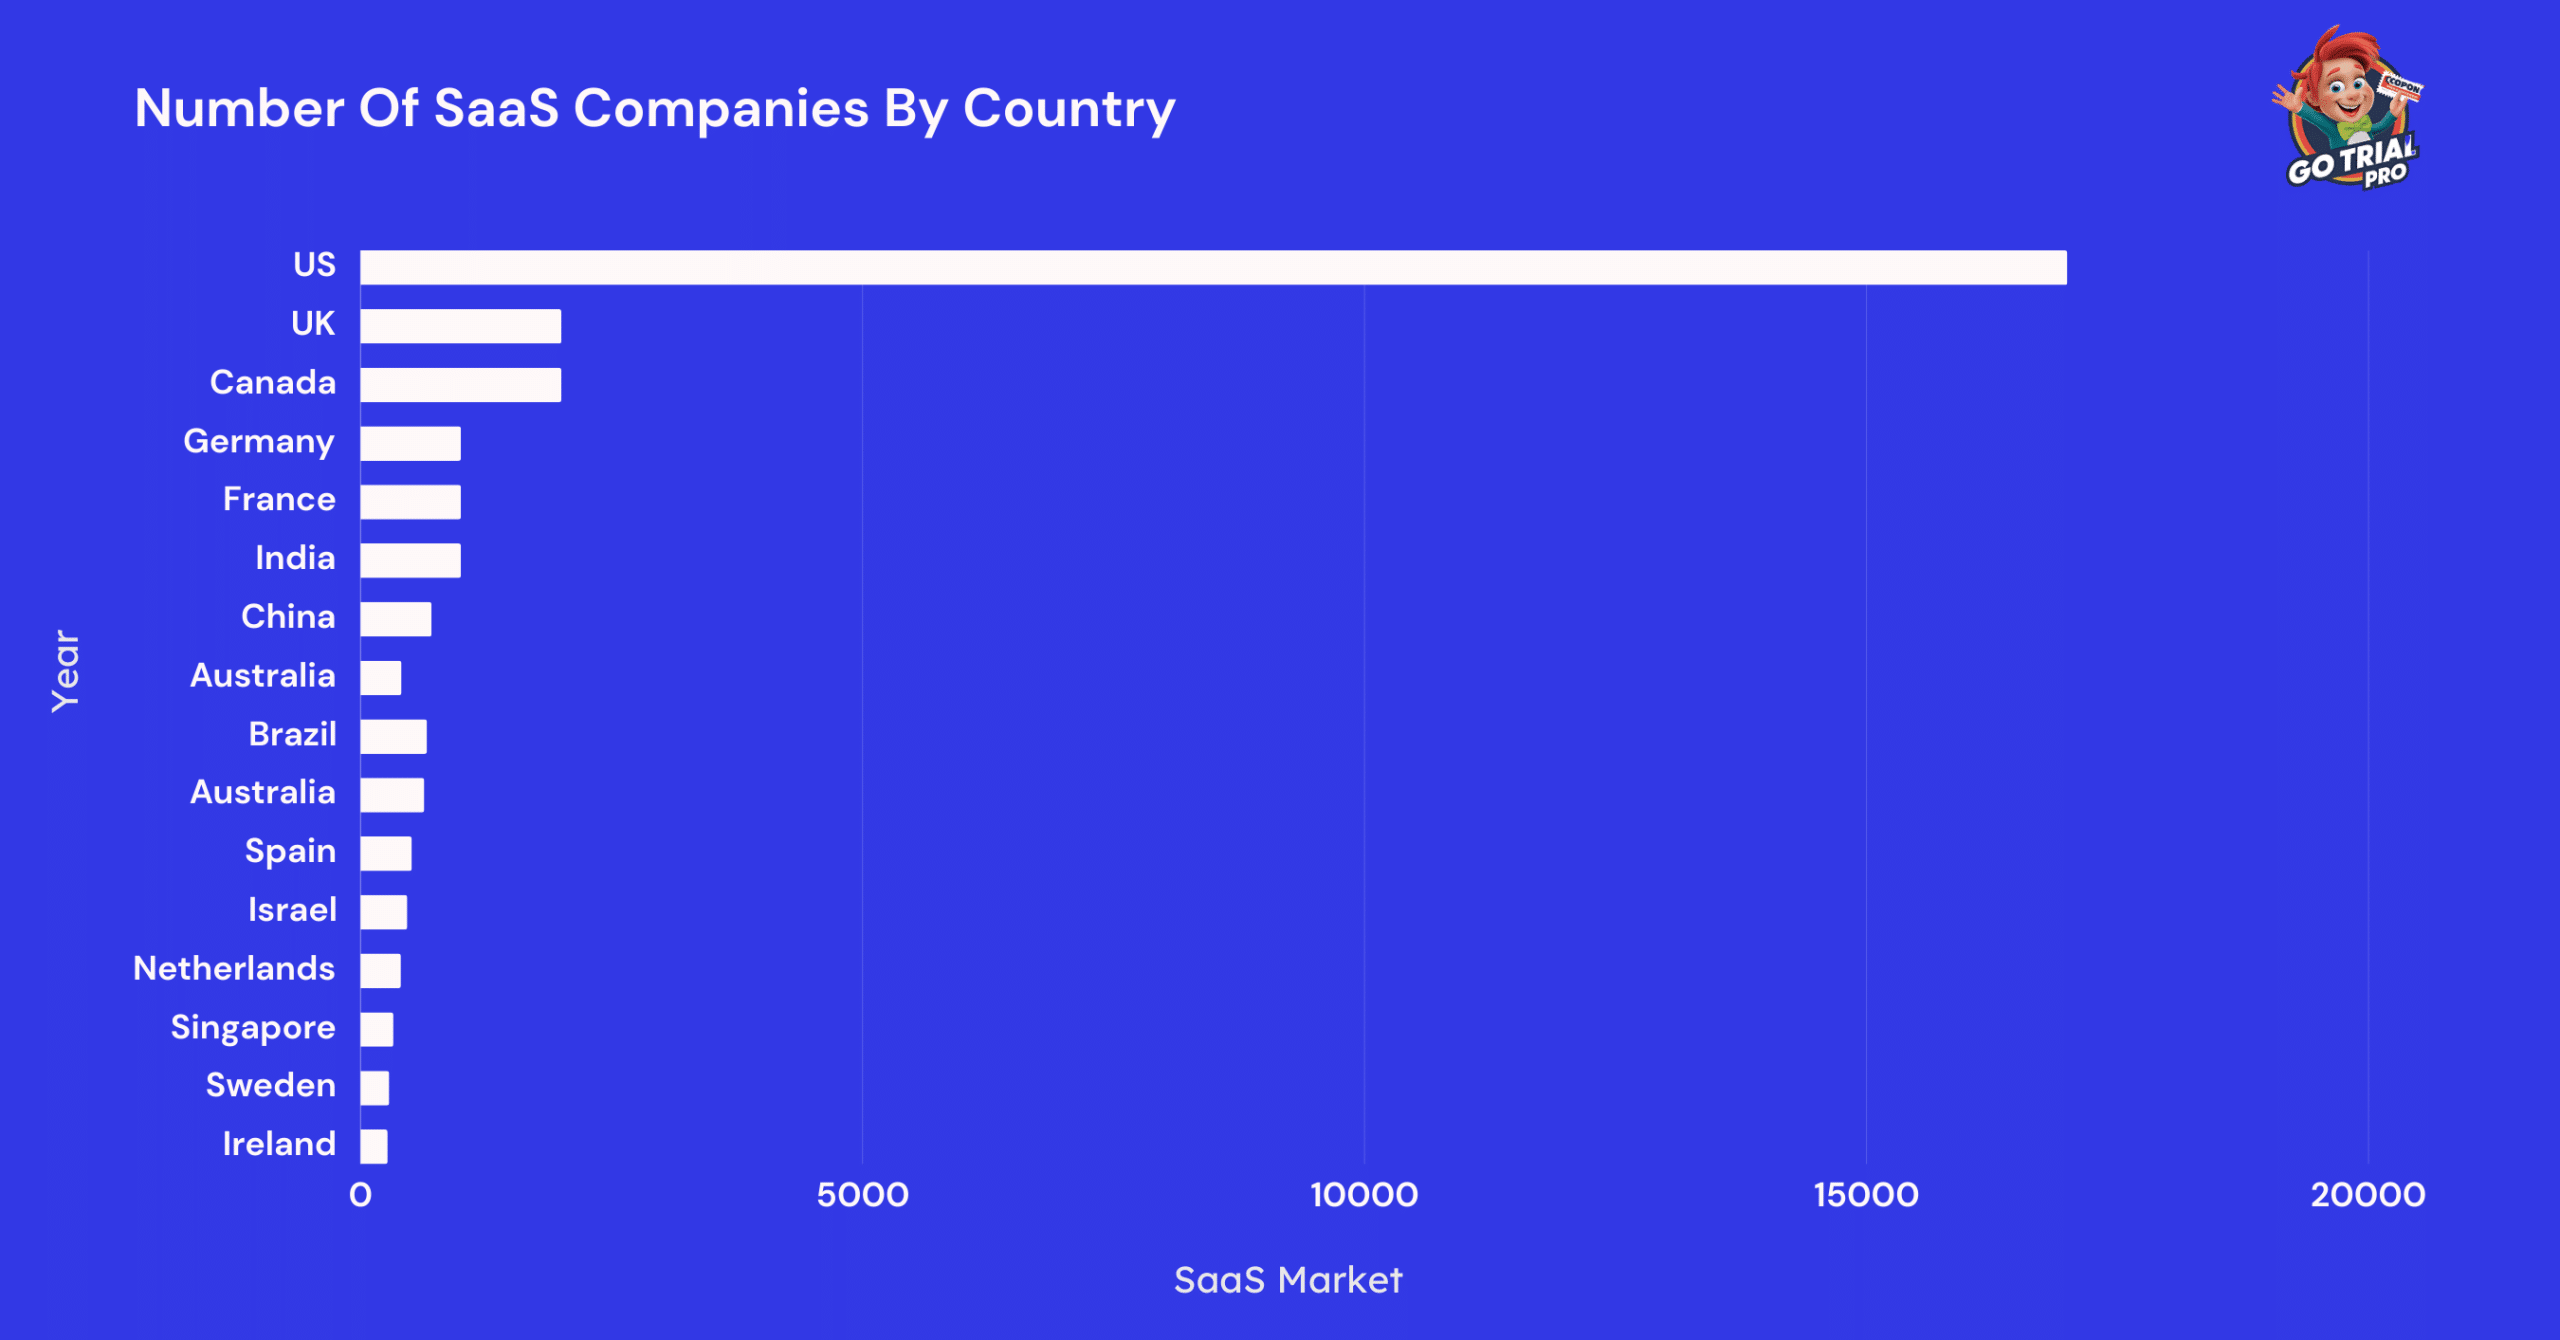
- There are 17,000 SaaS companies in the United States.
The United States has 8 times more SaaS companies than other countries.
The top 5 SaaS companies in the United States are Microsoft, Salesforce, SAP, Oracle, and Google. These companies are located in California, Washington, New York, Massachusetts, and Utah.
Comparatively, the United Kingdom has the second-highest number of SaaS companies worldwide, accounting for 2,000 SaaS companies.
Other countries with a high number of SaaS companies are Canada, Germany, and India.

Here is a table displaying the number of SaaS companies recorded in the United States and other countries worldwide.
| Country | Number of SaaS Companies |
|---|---|
| United States | 17,000 |
| United Kingdom | 2,000 |
| Canada | 2,000 |
| Germany | 1,000 |
| France | 1,000 |
| India | 1,000 |
| China | 707 |
| Australia | 408 |
| Brazil | 662 |
| Australia | 635 |
| Spain | 511 |
| Israel | 466 |
| Netherlands | 402 |
| Singapore | 327 |
| Sweden | 286 |
| Ireland | 270 |
Source: Ascendix
SaaS Companies By Industry
- 23% of the SaaS companies are from the productivity and collaboration industry.
They account for 24,365 SaaS companies worldwide.
Further, Customer Service SaaS companies account for 16% of the SaaS companies worldwide.
Conversely, the least number of SaaS companies are in the Finance sector, accounting for just 5% of the total SaaS companies worldwide.
Here is a table displaying the distribution of the SaaS companies by segment.
| Segment/ Industry | Percentage Of SaaS Companies | Number Of SaaS companies |
|---|---|---|
| Productivity & Collaboration | 23% | 24,365 |
| Customer Service | 16% | 17,035 |
| Marketing | 14% | 14,822 |
| e-commerce | 13% | 13,946 |
| Data Analytics | 11% | 12,359 |
| Sales | 11% | 11,559 |
| Human Resources | 8% | 8,265 |
| Finance | 5% | 5,452 |
Source: Ascendix
SaaS Adoption Statistics
- By 2025, 85% of the software companies use is estimated to be SaaS software.
Around 70% of the software used by companies today are SaaS software.
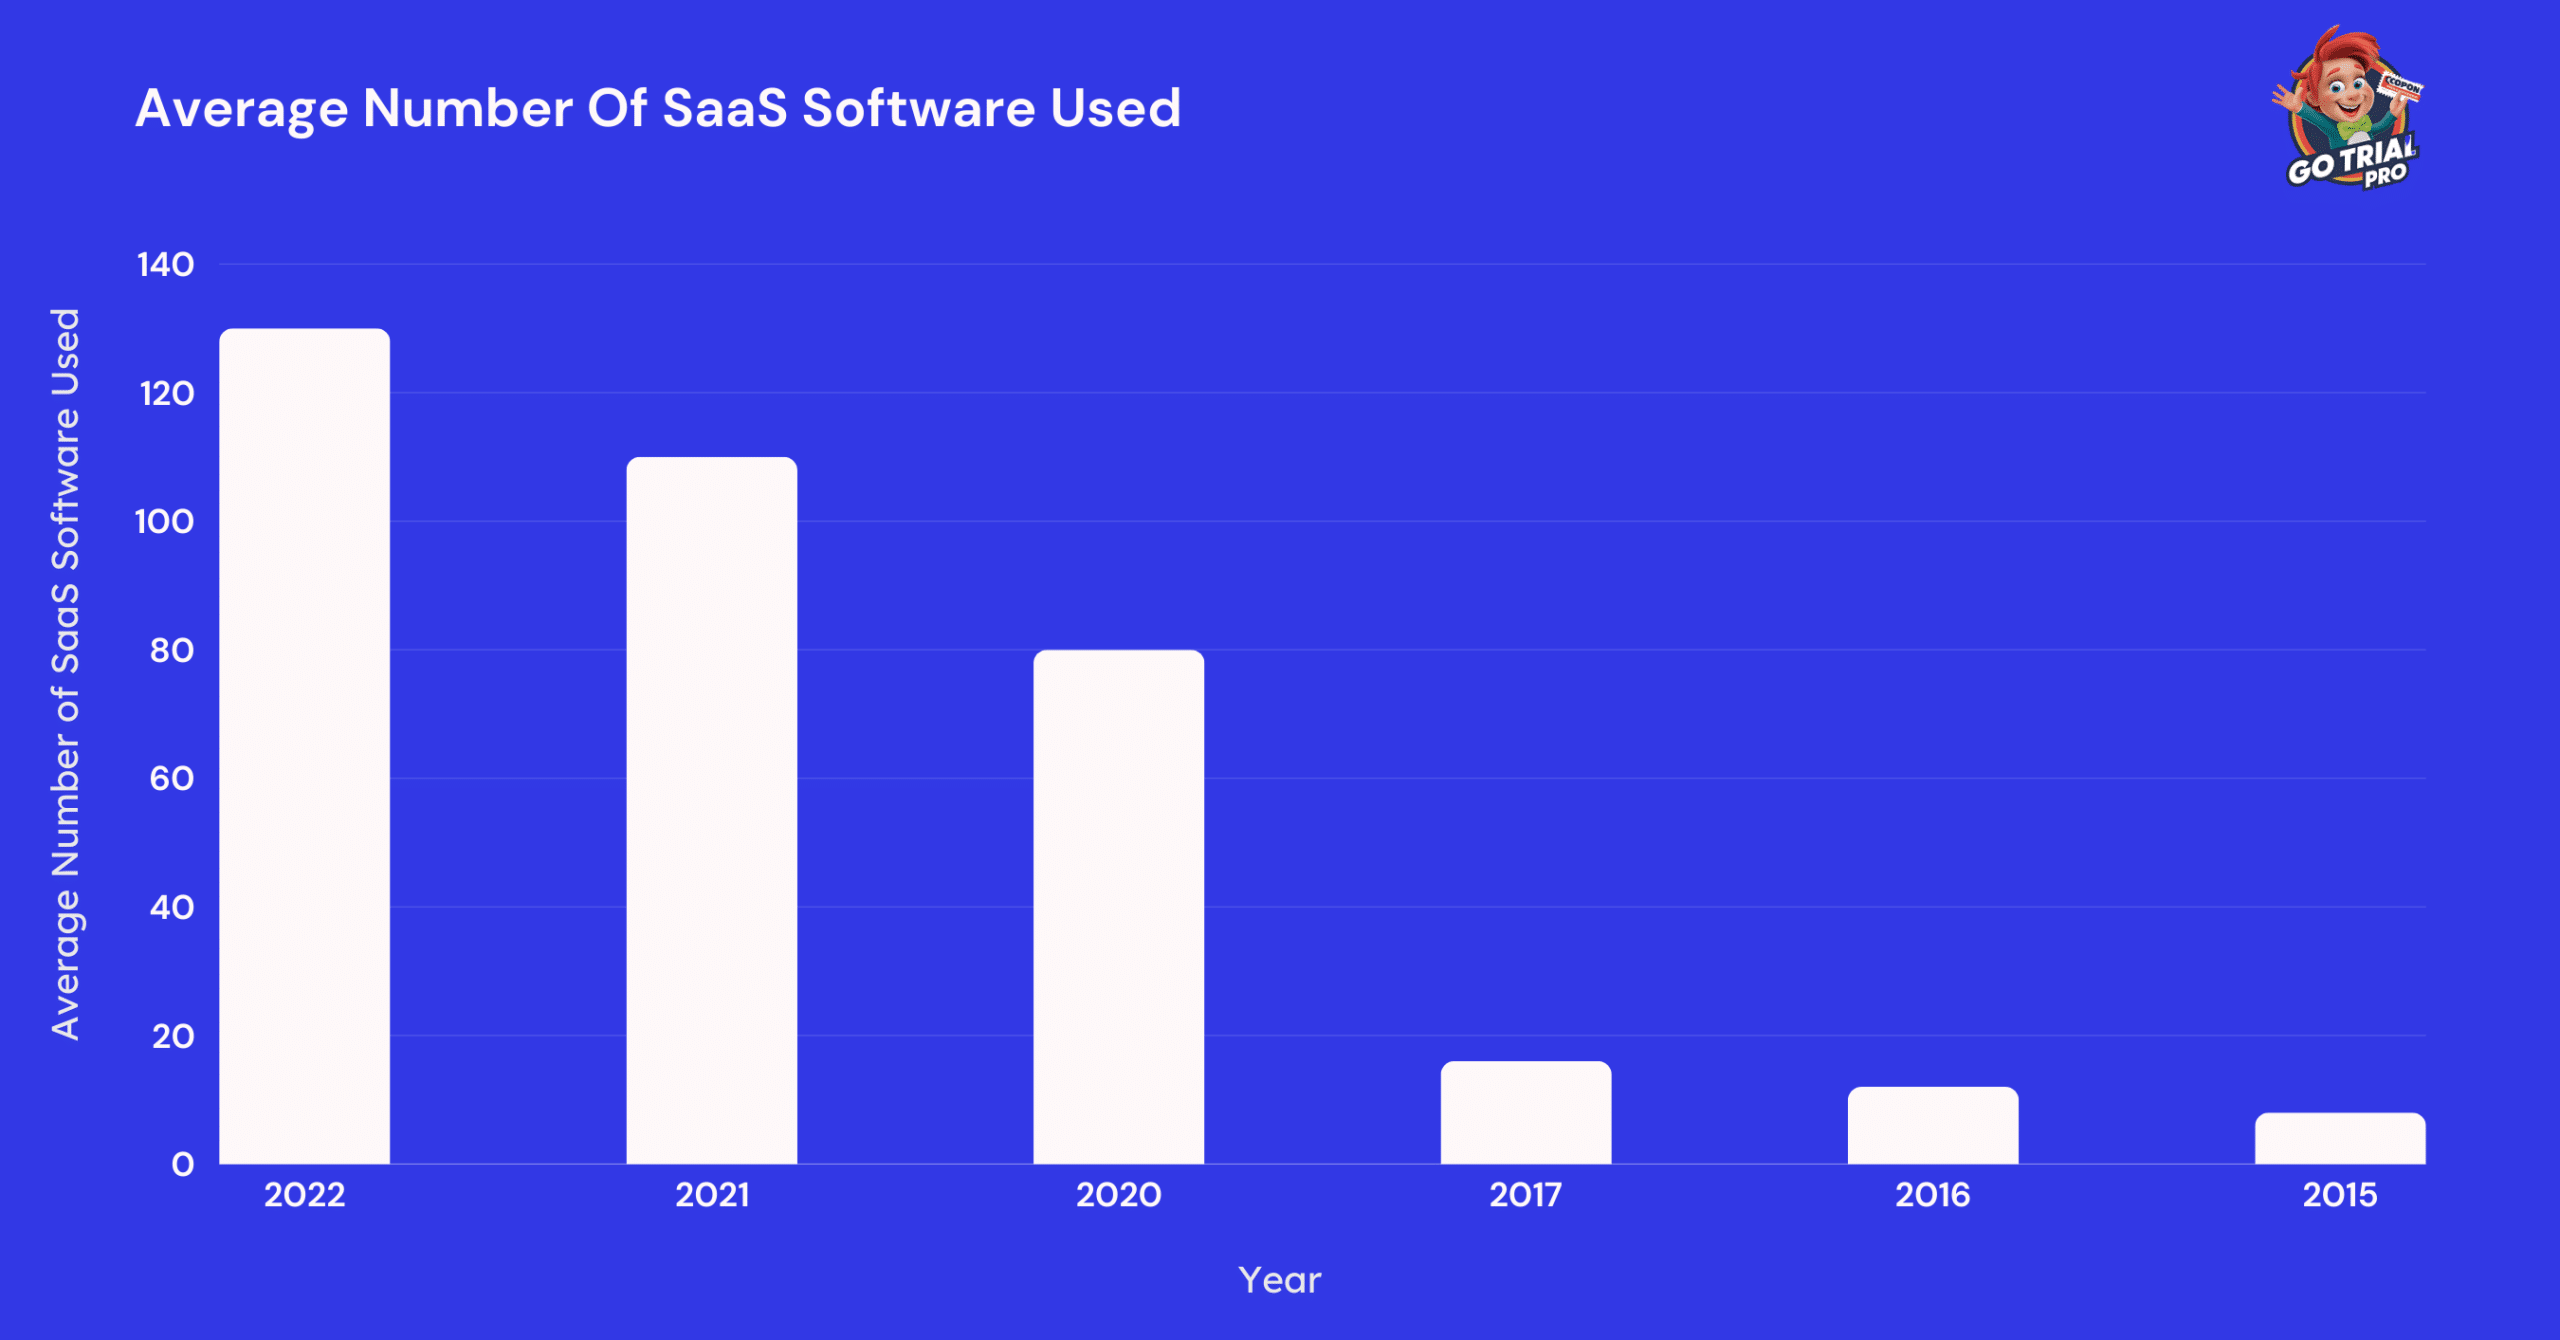
On average, a company uses 130 SaaS software as of the data recorded in 2022.
Comparatively, an average of 110 SaaS software were used by the companies in 2021, and in 2017, just 16 saaS software were used by the companies on average.

Here is a table displaying the average number of SaaS software used by a company over the years:
| Year | Average Number Of SaaS Software Used |
|---|---|
| 2022 | 130 |
| 2021 | 110 |
| 2020 | 80 |
| 2017 | 16 |
| 2016 | 12 |
| 2015 | 8 |
Source: Ascendix
- Companies that have less than 50 employees use 21 SaaS applications on average.
Meanwhile, companies with 50 to 99 employees use an average of 32 SaaS applications. That is a 52% increase in the number of average SaaS applications used in comparison to companies with less than 50 employees.
Further, the companies that have an employee count between 10 to 49 employees use 61 SaaS software, double that used by companies with 50 to 99 employees.
These numbers display that the larger organizations use a large number of SaaS software compared to that of the smaller organizations.
Communication and collaboration tools are the most used SaaS software by organizations, followed by human resource management and project management software.
Source: Ascendix
- The artificial intelligence industry was the leading industry in SaaS adoption, with nearly 3 million consumers.
The analytical software industry has the 2nd highest SaaS consumers. Besides, the eCommerce software industry has a similar number of SaaS consumers to the analytics software industry.
Here is a table displaying the top SaaS industries worldwide according to their consumers as of January 2024.
| Industry | Number of Consumers |
|---|---|
| Artificial Intelligence software | 2,900,000 |
| Analytics software | 1,900,000 |
| E-commerce software | 1,900,000 |
| Security software | 1,900,000 |
| Development software | 1,700,000 |
| Legal software | 1,400,000 |
| Financial services software | 1,300,000 |
| Marketing software | 1,300,000 |
| Communications & media software | 1,000,000 |
| Blockchain software | 1,000,000 |
Source: Statista.
- There are over 337 B2B SaaS companies with a ‘Unicorn’ status.
These companies have a valuation of over $1 billion.
The number of unicorns in the SaaS industry has grown rapidly over the past few years.
Here are some of the top SaaS Unicorn companies:
| SaaS Company | Location | Number of Employees | Valuation |
|---|---|---|---|
| Zoom | San Jose, California | Over 3,500 | $35 billion |
| Slack | San Francisco, California | Over 2,800 | $15 billion |
| DocuSign | San Francisco, California | Over 3,000 | $6 billion |
| PagerDuty | San Francisco, California | Over 800 | $2 billion |
| Datadog | New York City, New York | Over 2,000 | $15 billion |
| HubSpot | Cambridge, Massachusetts | Over 3,000 | $5 billion |
| CrowdStrike | Sunnyvale, California | Over 2,500 | $7 billion |
| Okta | San Francisco, California | Over 1,500 | $14 billion |
| AppFolio | Santa Barbara, California | Over 1,200 | $3 billion |
| Twilio | San Francisco, California | Over 3,000 | $40 billion |
Source: Ascendix
- SaaS startup models accounted for 2 times more than any other startup model in the country.
SaaS is the leading Startup model in Brazil. It accounts for twice as many startups in the country.
A total of 41.12% of the startups in Brazil were SaaS startups.
Source: Startup Base.
SaaS Marketing Statistics
- Over 11 in 20 SaaS marketing professionals prefer to use a combination of in-house and outsourced staff to achieve their marketing goals.
This helps with cost management as well as efficient work management.
Source: Hubspot
SaaS Security And Challenges
- 43% of the companies stated that identity and access governance are the major challenges in SaaS adoption.
Meanwhile, 4 in 10 companies stated that the major challenges in the adoption of SaaS companies are the 3rd party application access and their level of permissions.
On the other hand, over 3 in 10 companies tested that connected malicious apps are one of the major threats in the adoption of SaaS.
Here is a table displaying the top security concerns companies have when adopting SaaS applications in their company.
| Challenges of SaaS Adoption | Percentage of Companies |
|---|---|
| 3rd party application access and their level of permissions | 40% |
| Connected malicious apps | 31% |
| Data loss management | 32% |
| I am not aware of any SaaS-related risks or threats | 1% |
| Identity and access governance | 43% |
| SaaS misconfiguration | 29% |
| SaaS security personnel | 9% |
| SaaS user devices and their risk | 14% |
| Threat detection and response | 31% |
Source: Statista
Leading SaaS Company Statistics
- 33.6% of the SaaS market share is owned by Salesforce Adobe, Intuit, Service Now, and Shopify as of 2024.
These five companies make up one-third of the SaaS market Share.
Here is a table displaying the market cap and the industry of the top 10 SaaS companies worldwide.
| SaaS Company | Ticker | Market Cap |
|---|---|---|
| Salesforce, Inc. | CRM | 190.1 |
| Adobe Inc. | ADBE | 171.9 |
| Intuit Inc. | INTU | 120.5 |
| ServiceNow, Inc. | NOW | 87.9 |
| Shopify Inc. | SHOP | 57.4 |
| Workday, Inc. | WDAY | 49.3 |
| Snowflake Inc. | SNOW | 43.9 |
| Autodesk, Inc. | ADSK | 43 |
| Atlassian Corporation | TEAM | 39.1 |
| Square, Inc. | SQ | 36.5 |
Source: Ascendix
- Salesforce generated a revenue of $34.86 billion in the fiscal year 2024.
That’s an increase of 11.2% compared to the previous year. In 2023, Salesforce generated an annual revenue of 31.35 billion.
Further, between 2019 and 2024, the annual revenue of the salesforce increased by $21.6 billion.
Here is a table displaying the annual revenue generated by Salesforce over the fiscal years.
| Fiscal Year | Salesforce Revenue |
|---|---|
| 2024 | 34.86 billion |
| 2023 | 31.35 billion |
| 2022 | 26.49 billion |
| 2021 | 21.25 billion |
| 2020 | 17.1 billion |
| 2019 | 13.28 billion |
| 2018 | 10.54 billion |
| 2017 | 8.39 billion |
| 2016 | 6.67 billion |
| 2015 | 5.37 billion |
| 2014 | 4.07 billion |
| 2013 | 3.05 billion |
| 2012 | 2.27 billion |
Source: Statista.
- In the fiscal year 2024, Oracle generated a revenue of $39.38 billion in 2024 through colid services and license support.
The majority of Oracle’s revenue comes from cloud services and license support.
Apart from that, Cloud license and on-premise license revenue and Services revenues also contribute a significant share of Oracle’s revenue. Conversely, hardware contributes the lowest share of revenue.
In fiscal 2024, Oracle generated nearly $52 billion in revenue.
Here is a table displaying Oracle’s revenue by business segment recorded over the years.
| Year | Cloud Services And License Support | Cloud License And On-premise License | Hardware | Services Revenues |
|---|---|---|---|---|
| 2024 | 39.38 billion | 5.08 billion | 3.07 billion | 5.43 billion |
| 2023 | 35.31 billion | 5.78 billion | 3.27 billion | 5.59 billion |
| 2022 | 30.17 billion | 5.89 billion | 3.18 billion | 3.20 billion |
| 2021 | 28.70 billion | 5.4 billion | 3.36 billion | 3.02 billion |
| 2020 | 27.4 billion | 5.13 billion | 3.44 billion | 3.11 billion |
| 2019 | 26.78 billion | 5.86 billion | 3.70 billion | 3.24 billion |
| 2018 | 26.25 billion | 6.19 billion | 3.99 billion | 3.39 billion |
Source: Statista.
- Dropbox generated a revenue of $2.5 billion in 2023.
That was an increase of nearly 0.2 billion compared to the previous year. In 2022, dropbox recorded a total revenue of $2.32 billion.
Further, Dropbox’s revenue grew from $0.6 billion in 2015 to $2.5 billion in 2023. That’s a total increase of $2 billion in 8 years.
Here is a table displaying the number of Dropbox revenue recorded over the years.
| Year | Dropbox Revenue |
|---|---|
| 2023 | 2.5 billion |
| 2022 | 2.32 billion |
| 2021 | 2.16 billion |
| 2020 | 1.91 billion |
| 2019 | 1.66 billion |
| 2018 | 1.39 billion |
| 2017 | 1.11 billion |
| 2016 | 0.84 billion |
| 2015 | 0.6 billion |
Source: Statista
Conclusion: 30,800 SaaS Companies Are There Worldwide!
The majority of SaaS companies are from the United States. The adoption of SaaS has peaked in the United States as well as other developing countries worldwide.
Besides, North America is a dominant player in the SaaS industry and accounts for nearly half of the SaaS market share.
On the other hand, businesses worldwide are rapidly adopting SaaS software, highlighting its critical role in driving efficiency and innovation across various sectors.
In conclusion, the SaaS industry continues to experience remarkable growth, driven by its ability to offer scalable and cost-effective solutions.
